Explore Workflows
View already parsed workflows here or click here to add your own
| Graph | Name | Retrieved From | View |
|---|---|---|---|
|
|
advanced-header.cwl
|
Path: metadata/advanced-header.cwl Branch/Commit ID: e28e33222cce3daf30c69def6e46f0e9baf9e5d4 |
|
|
|
Subworkflow to allow calling different SV callers which require bam files as inputs
|
Path: definitions/subworkflows/single_sample_sv_callers.cwl Branch/Commit ID: a23f42ef49c10a588fd35a3afaad5de03e253533 |
|
|
|
Detect Variants workflow
|
Path: definitions/pipelines/detect_variants_mouse.cwl Branch/Commit ID: a23f42ef49c10a588fd35a3afaad5de03e253533 |
|
|
|
QuantSeq 3' mRNA-Seq single-read
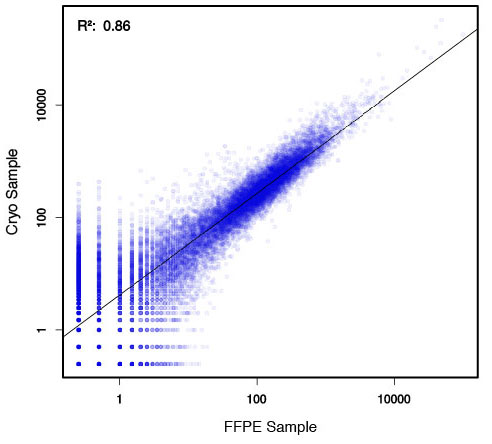
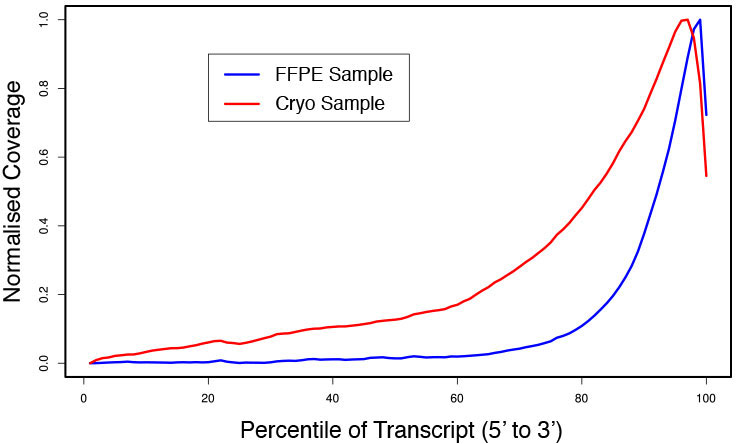
### Pipeline for Lexogen's QuantSeq 3' mRNA-Seq Library Prep Kit FWD for Illumina [Lexogen original documentation](https://www.lexogen.com/quantseq-3mrna-sequencing/) * Cost-saving and streamlined globin mRNA depletion during QuantSeq library preparation * Genome-wide analysis of gene expression * Cost-efficient alternative to microarrays and standard RNA-Seq * Down to 100 pg total RNA input * Applicable for low quality and FFPE samples * Single-read sequencing of up to 9,216 samples/lane * Dual indexing and Unique Molecular Identifiers (UMIs) are available ### QuantSeq 3’ mRNA-Seq Library Prep Kit FWD for Illumina The QuantSeq FWD Kit is a library preparation protocol designed to generate Illumina compatible libraries of sequences close to the 3’ end of polyadenylated RNA. QuantSeq FWD contains the Illumina Read 1 linker sequence in the second strand synthesis primer, hence NGS reads are generated towards the poly(A) tail, directly reflecting the mRNA sequence (see workflow). This version is the recommended standard for gene expression analysis. Lexogen furthermore provides a high-throughput version with optional dual indexing (i5 and i7 indices) allowing up to 9,216 samples to be multiplexed in one lane. #### Analysis of Low Input and Low Quality Samples The required input amount of total RNA is as low as 100 pg. QuantSeq is suitable to reproducibly generate libraries from low quality RNA, including FFPE samples. See Fig.1 and 2 for a comparison of two different RNA qualities (FFPE and fresh frozen cryo-block) of the same sample.  Figure 1 | Correlation of gene counts of FFPE and cryo samples.  Figure 2 | Venn diagrams of genes detected by QuantSeq at a uniform read depth of 2.5 M reads in FFPE and cryo samples with 1, 5, and 10 reads/gene thresholds. #### Mapping of Transcript End Sites By using longer reads QuantSeq FWD allows to exactly pinpoint the 3’ end of poly(A) RNA (see Fig. 3) and therefore obtain accurate information about the 3’ UTR.  Figure 3 | QuantSeq read coverage versus normalized transcript length of NGS libraries derived from FFPE-RNA (blue) and cryo-preserved RNA (red). ### Current workflow should be used only with the single-end RNA-Seq data. It performs the following steps: 1. Separates UMIes and trims adapters from input FASTQ file 2. Uses ```STAR``` to align reads from input FASTQ file according to the predefined reference indices; generates unsorted BAM file and alignment statistics file 3. Uses ```fastx_quality_stats``` to analyze input FASTQ file and generates quality statistics file 4. Uses ```samtools sort``` and generates coordinate sorted BAM(+BAI) file pair from the unsorted BAM file obtained on the step 2 (after running STAR) 5. Uses ```umi_tools dedup``` and generates final filtered sorted BAM(+BAI) file pair 6. Generates BigWig file on the base of sorted BAM file 7. Maps input FASTQ file to predefined rRNA reference indices using ```bowtie``` to define the level of rRNA contamination; exports resulted statistics to file 8. Calculates isoform expression level for the sorted BAM file and GTF/TAB annotation file using GEEP reads-counting utility; exports results to file |
Path: workflows/trim-quantseq-mrnaseq-se.cwl Branch/Commit ID: e0a30aa1ad516dd2ec0e9ce006428964b840daf4 |
|
|
|
exome alignment and somatic variant detection for cle purpose
|
Path: definitions/pipelines/cle_somatic_exome.cwl Branch/Commit ID: 0805e8e0d358136468e0a9f49e06005e41965adc |
|
|
|
wgs alignment and germline variant detection
|
Path: definitions/pipelines/germline_wgs.cwl Branch/Commit ID: a23f42ef49c10a588fd35a3afaad5de03e253533 |
|
|
|
kmer_build_tree
|
Path: task_types/tt_kmer_build_tree.cwl Branch/Commit ID: 4ea5956bb97ea2eb6de124bc9b6a6a81a14fd2e7 |
|
|
|
sum-wf-noET.cwl
|
Path: tests/sum-wf-noET.cwl Branch/Commit ID: b1d4a69df86350059bd49aa127c02be0c349f7de |
|
|
|
Subworkflow to allow calling cnvkit with cram instead of bam files
|
Path: definitions/subworkflows/cram_to_cnvkit.cwl Branch/Commit ID: ae57b60e9b01e3f0f02f4e828042748409dff5a3 |
|
|
|
SoupX (workflow) - an R package for the estimation and removal of cell free mRNA contamination
Wrapped in a workflow SoupX tool for easy access to Cell Ranger pipeline compressed outputs. |
Path: tools/soupx-subworkflow.cwl Branch/Commit ID: 92f1a6da9c4f85fb51340b01b32373a50fde0891 |


