Explore Workflows
View already parsed workflows here or click here to add your own
| Graph | Name | Retrieved From | View |
|---|---|---|---|
|
|
QuantSeq 3' FWD, FWD-UMI or REV for single-read mRNA-Seq data
### Devel version of QuantSeq 3' FWD, FWD-UMI or REV for single-read mRNA-Seq data |
Path: workflows/trim-quantseq-mrnaseq-se-strand-specific.cwl Branch/Commit ID: 581156366f91861bd4dbb5bcb59f67d468b32af3 |
|
|
|
directory.cwl
Inspect provided directory and return filenames. Generate a new directory and return it (including content). |
Path: tests/wf/directory.cwl Branch/Commit ID: e6c2d955a448225f026a04130443d13661844440 |
|
|
|
rRNA_selection.cwl
|
Path: tools/rRNA_selection.cwl Branch/Commit ID: 9c57dba558a4e04a1884eae1df8431dcaccafc1e |
|
|
|
RNA-Seq pipeline single-read
The original [BioWardrobe's](https://biowardrobe.com) [PubMed ID:26248465](https://www.ncbi.nlm.nih.gov/pubmed/26248465) **RNA-Seq** basic analysis for a **single-read** experiment. A corresponded input [FASTQ](http://maq.sourceforge.net/fastq.shtml) file has to be provided. Current workflow should be used only with the single-read RNA-Seq data. It performs the following steps: 1. Use STAR to align reads from input FASTQ file according to the predefined reference indices; generate unsorted BAM file and alignment statistics file 2. Use fastx_quality_stats to analyze input FASTQ file and generate quality statistics file 3. Use samtools sort to generate coordinate sorted BAM(+BAI) file pair from the unsorted BAM file obtained on the step 1 (after running STAR) 5. Generate BigWig file on the base of sorted BAM file 6. Map input FASTQ file to predefined rRNA reference indices using Bowtie to define the level of rRNA contamination; export resulted statistics to file 7. Calculate isoform expression level for the sorted BAM file and GTF/TAB annotation file using GEEP reads-counting utility; export results to file |
Path: workflows/rnaseq-se.cwl Branch/Commit ID: e99e80a2c19682d59947bde04a892d7b6d90091c |
|
|
|
RNA-Seq pipeline paired-end
The original [BioWardrobe's](https://biowardrobe.com) [PubMed ID:26248465](https://www.ncbi.nlm.nih.gov/pubmed/26248465) **RNA-Seq** basic analysis for a **paired-end** experiment. A corresponded input [FASTQ](http://maq.sourceforge.net/fastq.shtml) file has to be provided. Current workflow should be used only with the paired-end RNA-Seq data. It performs the following steps: 1. Use STAR to align reads from input FASTQ files according to the predefined reference indices; generate unsorted BAM file and alignment statistics file 2. Use fastx_quality_stats to analyze input FASTQ files and generate quality statistics files 3. Use samtools sort to generate coordinate sorted BAM(+BAI) file pair from the unsorted BAM file obtained on the step 1 (after running STAR) 4. Generate BigWig file on the base of sorted BAM file 5. Map input FASTQ files to predefined rRNA reference indices using Bowtie to define the level of rRNA contamination; export resulted statistics to file 6. Calculate isoform expression level for the sorted BAM file and GTF/TAB annotation file using GEEP reads-counting utility; export results to file |
Path: workflows/rnaseq-pe.cwl Branch/Commit ID: d6ec0dee61ef65a110e10141bde1a79332a64ab0 |
|
|
|
xenbase-fastq-bowtie-bigwig-se-pe.cwl
|
Path: subworkflows/xenbase-fastq-bowtie-bigwig-se-pe.cwl Branch/Commit ID: 7a4593d2fa5b2fcbedc9219dc5687a4bc5aea66a |
|
|
|
GAT - Genomic Association Tester
GAT: Genomic Association Tester ============================================== A common question in genomic analysis is whether two sets of genomic intervals overlap significantly. This question arises, for example, in the interpretation of ChIP-Seq or RNA-Seq data. The Genomic Association Tester (GAT) is a tool for computing the significance of overlap between multiple sets of genomic intervals. GAT estimates significance based on simulation. Gat implemements a sampling algorithm. Given a chromosome (workspace) and segments of interest, for example from a ChIP-Seq experiment, gat creates randomized version of the segments of interest falling into the workspace. These sampled segments are then compared to existing genomic annotations. The sampling method is conceptually simple. Randomized samples of the segments of interest are created in a two-step procedure. Firstly, a segment size is selected from to same size distribution as the original segments of interest. Secondly, a random position is assigned to the segment. The sampling stops when exactly the same number of nucleotides have been sampled. To improve the speed of sampling, segment overlap is not resolved until the very end of the sampling procedure. Conflicts are then resolved by randomly removing and re-sampling segments until a covering set has been achieved. Because the size of randomized segments is derived from the observed segment size distribution of the segments of interest, the actual segment sizes in the sampled segments are usually not exactly identical to the ones in the segments of interest. This is in contrast to a sampling method that permutes segment positions within the workspace. |
Path: workflows/gat-run.cwl Branch/Commit ID: 8a92669a566589d80fde9d151054ffc220ed4ddd |
|
|
|
iwdr_with_nested_dirs.cwl
|
Path: cwltool/schemas/v1.0/v1.0/iwdr_with_nested_dirs.cwl Branch/Commit ID: 8d8512061f2367c90aac67bcbf92af1061b4af59 |
|
|
|
QuantSeq 3' mRNA-Seq single-read
### Pipeline for Lexogen's QuantSeq 3' mRNA-Seq Library Prep Kit FWD for Illumina [Lexogen original documentation](https://www.lexogen.com/quantseq-3mrna-sequencing/) * Cost-saving and streamlined globin mRNA depletion during QuantSeq library preparation * Genome-wide analysis of gene expression * Cost-efficient alternative to microarrays and standard RNA-Seq * Down to 100 pg total RNA input * Applicable for low quality and FFPE samples * Single-read sequencing of up to 9,216 samples/lane * Dual indexing and Unique Molecular Identifiers (UMIs) are available ### QuantSeq 3’ mRNA-Seq Library Prep Kit FWD for Illumina The QuantSeq FWD Kit is a library preparation protocol designed to generate Illumina compatible libraries of sequences close to the 3’ end of polyadenylated RNA. QuantSeq FWD contains the Illumina Read 1 linker sequence in the second strand synthesis primer, hence NGS reads are generated towards the poly(A) tail, directly reflecting the mRNA sequence (see workflow). This version is the recommended standard for gene expression analysis. Lexogen furthermore provides a high-throughput version with optional dual indexing (i5 and i7 indices) allowing up to 9,216 samples to be multiplexed in one lane. #### Analysis of Low Input and Low Quality Samples The required input amount of total RNA is as low as 100 pg. QuantSeq is suitable to reproducibly generate libraries from low quality RNA, including FFPE samples. See Fig.1 and 2 for a comparison of two different RNA qualities (FFPE and fresh frozen cryo-block) of the same sample. 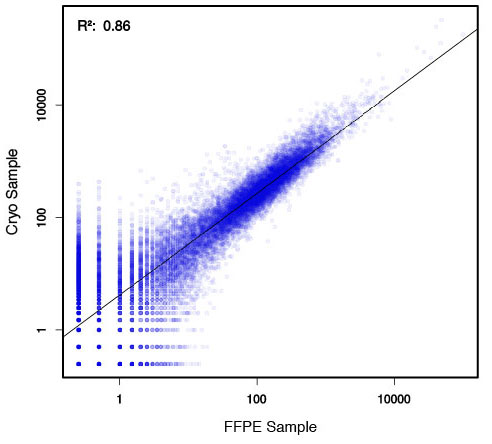 Figure 1 | Correlation of gene counts of FFPE and cryo samples. 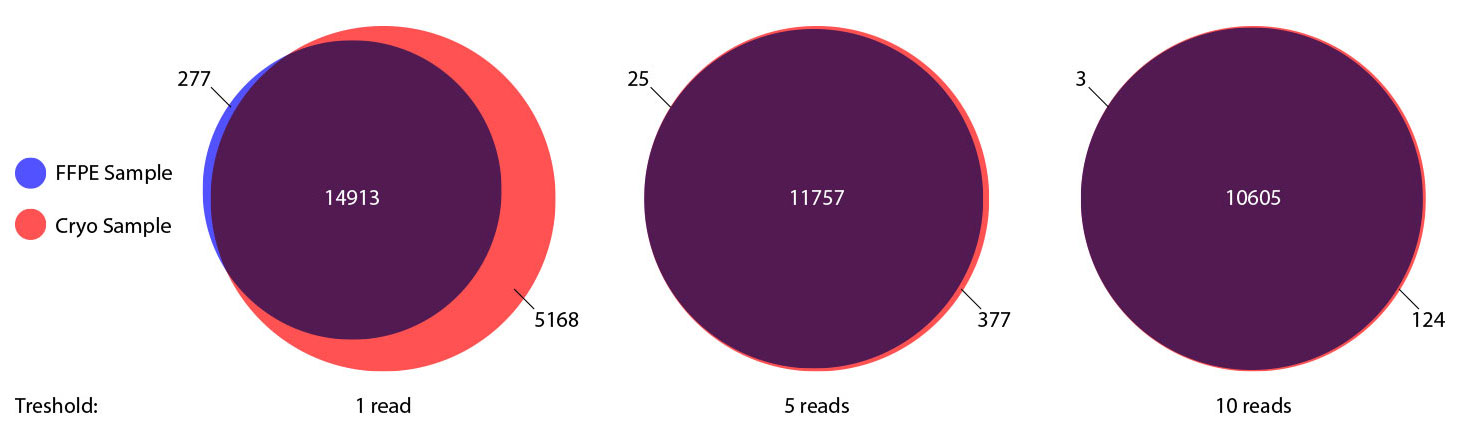 Figure 2 | Venn diagrams of genes detected by QuantSeq at a uniform read depth of 2.5 M reads in FFPE and cryo samples with 1, 5, and 10 reads/gene thresholds. #### Mapping of Transcript End Sites By using longer reads QuantSeq FWD allows to exactly pinpoint the 3’ end of poly(A) RNA (see Fig. 3) and therefore obtain accurate information about the 3’ UTR. 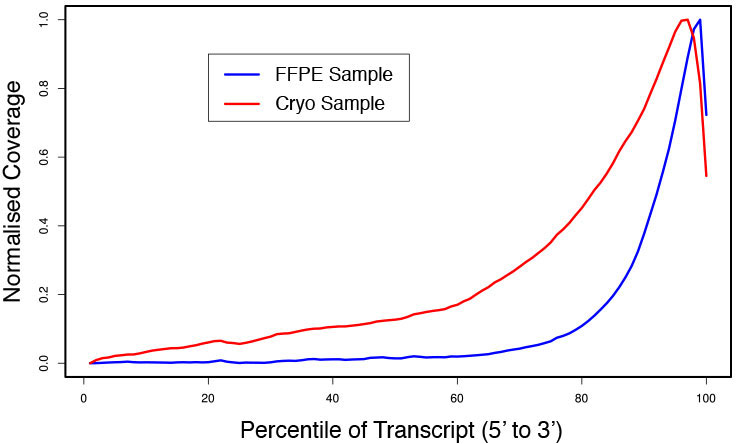 Figure 3 | QuantSeq read coverage versus normalized transcript length of NGS libraries derived from FFPE-RNA (blue) and cryo-preserved RNA (red). ### Current workflow should be used only with the single-end RNA-Seq data. It performs the following steps: 1. Separates UMIes and trims adapters from input FASTQ file 2. Uses ```STAR``` to align reads from input FASTQ file according to the predefined reference indices; generates unsorted BAM file and alignment statistics file 3. Uses ```fastx_quality_stats``` to analyze input FASTQ file and generates quality statistics file 4. Uses ```samtools sort``` and generates coordinate sorted BAM(+BAI) file pair from the unsorted BAM file obtained on the step 2 (after running STAR) 5. Uses ```umi_tools dedup``` and generates final filtered sorted BAM(+BAI) file pair 6. Generates BigWig file on the base of sorted BAM file 7. Maps input FASTQ file to predefined rRNA reference indices using ```bowtie``` to define the level of rRNA contamination; exports resulted statistics to file 8. Calculates isoform expression level for the sorted BAM file and GTF/TAB annotation file using GEEP reads-counting utility; exports results to file |
Path: workflows/trim-quantseq-mrnaseq-se.cwl Branch/Commit ID: b1a5dabeeeb9079b30b2871edd9c9034a1e00c1c |
|
|
|
SoupX - an R package for the estimation and removal of cell free mRNA contamination
Devel version of Single-Cell Advanced Cell Ranger Pipeline (SoupX) ================================================================= |
Path: workflows/soupx.cwl Branch/Commit ID: 8a92669a566589d80fde9d151054ffc220ed4ddd |

